I've not posted as much lately. Part of that is because I was feeling under the weather. The other part of it though is that I've been working on a new project that stretching me (in good ways).
I guess it's probably no surprise that numbers intrigue me. It's also (hopefully) no surprise I'm interested in using them in helpful ways. A while ago I wrote about tracking my workouts. I've been doing it for about a year now and it's been going great - mostly.
The "mostly" stems from the fact that the logging program I use interprets everything independently of one another. Even if multiple variables are tracked in one logger (like "Treadmill" tracks distance, time and calories), there is no easy way to do analysis and correlation against each other. That's mostly ok for workouts but for awhile now I've wanted to track more of life and see the relationship between things in a clearer way, like:
- How does sleep & what I eat & drink affect the distance I can go?
- What symptoms show up when workouts get paused? What symptoms disappear as they happen?
- Does the amount of water I drink affect the severity of sinus headaches?
- And on and on...
Knowing stuff like that gives you the ability to make intelligent decisions about life, what you need to do to feel certain ways, how to be the best you, etc but the logger I was using just wasn't doing the trick. So I started looking for something different for logging and discovered that I'm not the only one. A lot of the tools are limited and track specific things or are prohibitively expensive. So after a lot of thought, I've decided to do my own thing! ==That's my new project!==
I'm using a number of different techs for this:
- The datastore is a MongoDB setup on MongoDB's Free Forever Shared Cluster.
- I input data through Apple Shortcuts, mostly from my phone (but I could use my computer too).
- The shortcut uses a POST api build on nodejs to connect the shortcut to the MongoDB.
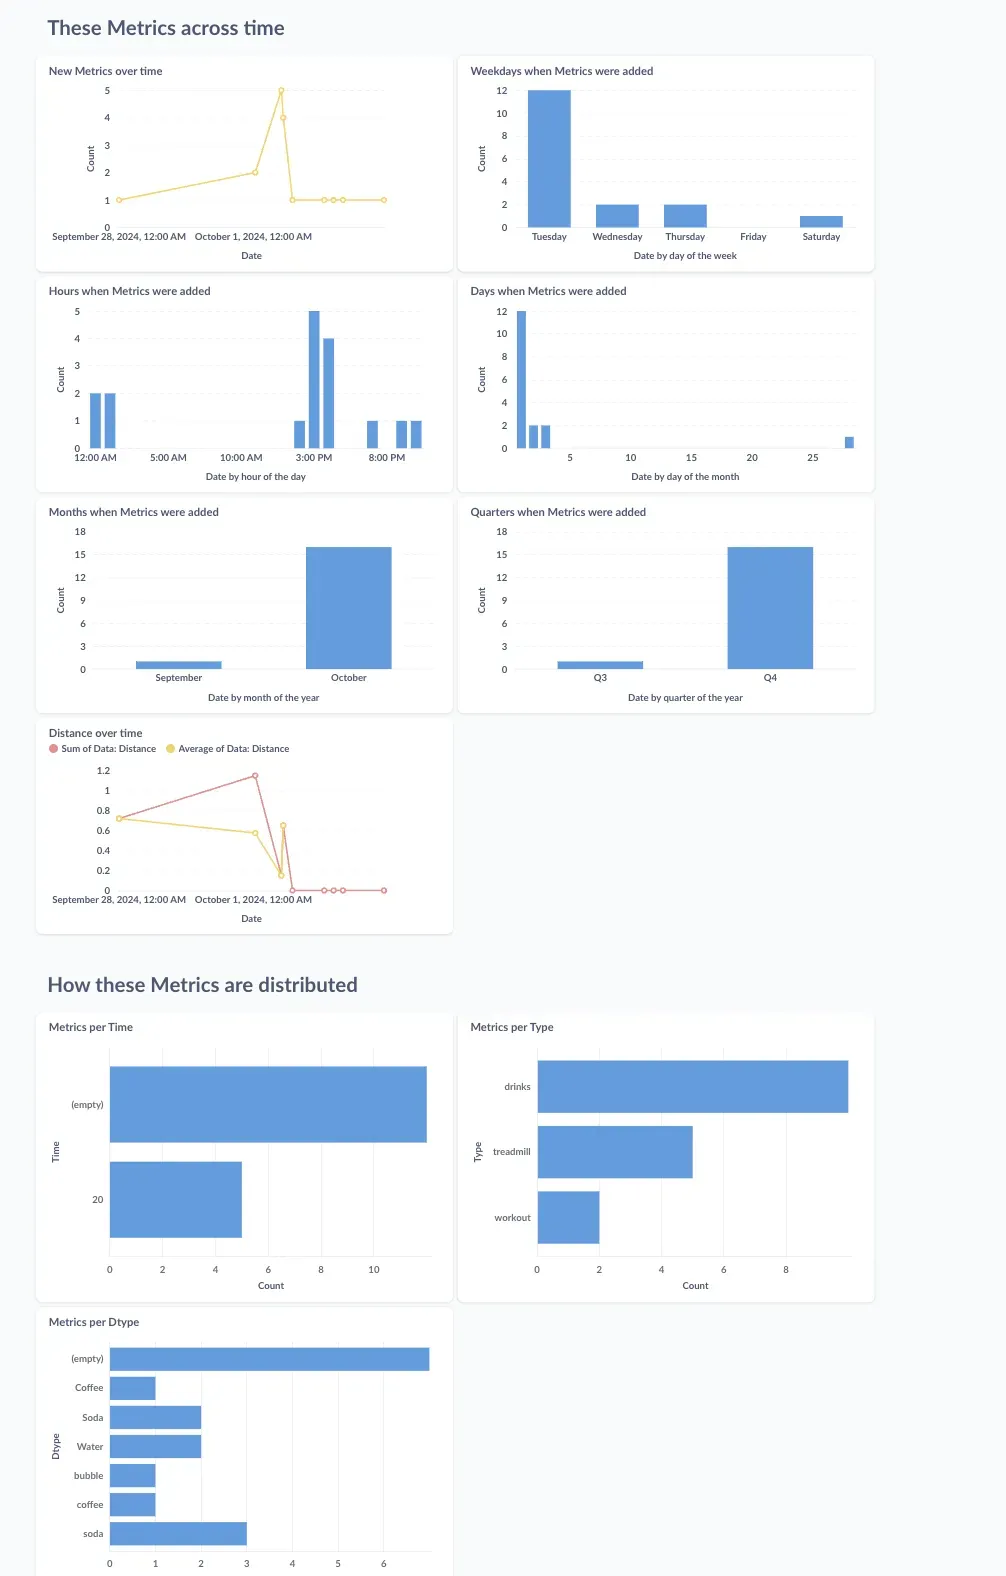
- Currently, I'm setting up my metrics dashboard using Metabase - the open source edition.

For the last week I've been piloting it with a limited dataset (tracking treadmill runs, drinks and general workouts) and it's going well! There's a lot of junk data in that database so in the next week I plan to make a prod database and add the categories I want to add.
In the future (assuming things go well) I'd love to:
- Make the nodejs API flexible enough to add new categories at will; currently I have to manually add in models.
- Explore a PWA for entering data (probably too advanced for me but you never know...).
- Potentially build my own dashboard rather than relying on something like Metabase (that could then be incorporated anywhere).
Anyways, that's what I've been up to! What about you?